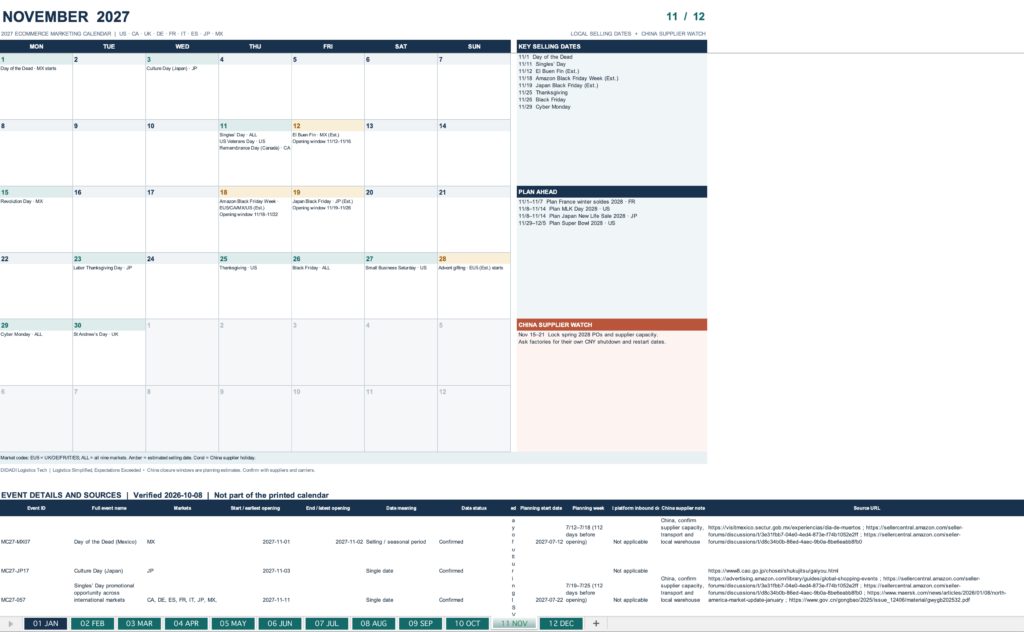
Marketing Calendar 2027: Can You Truly Plan the Year Around Lead Times, Not Dates?
Every ambitious brand relies on a marketing calendar 2027 to drive sales, yet most product launches fail1 because marketing teams look at holiday dates instead of supply chain realities. You design creative promotions and schedule ad spends, only to watch stock sit trapped on a container ship or stranded in customs. You can eliminate stockouts by reverse-engineering your procurement schedules today.
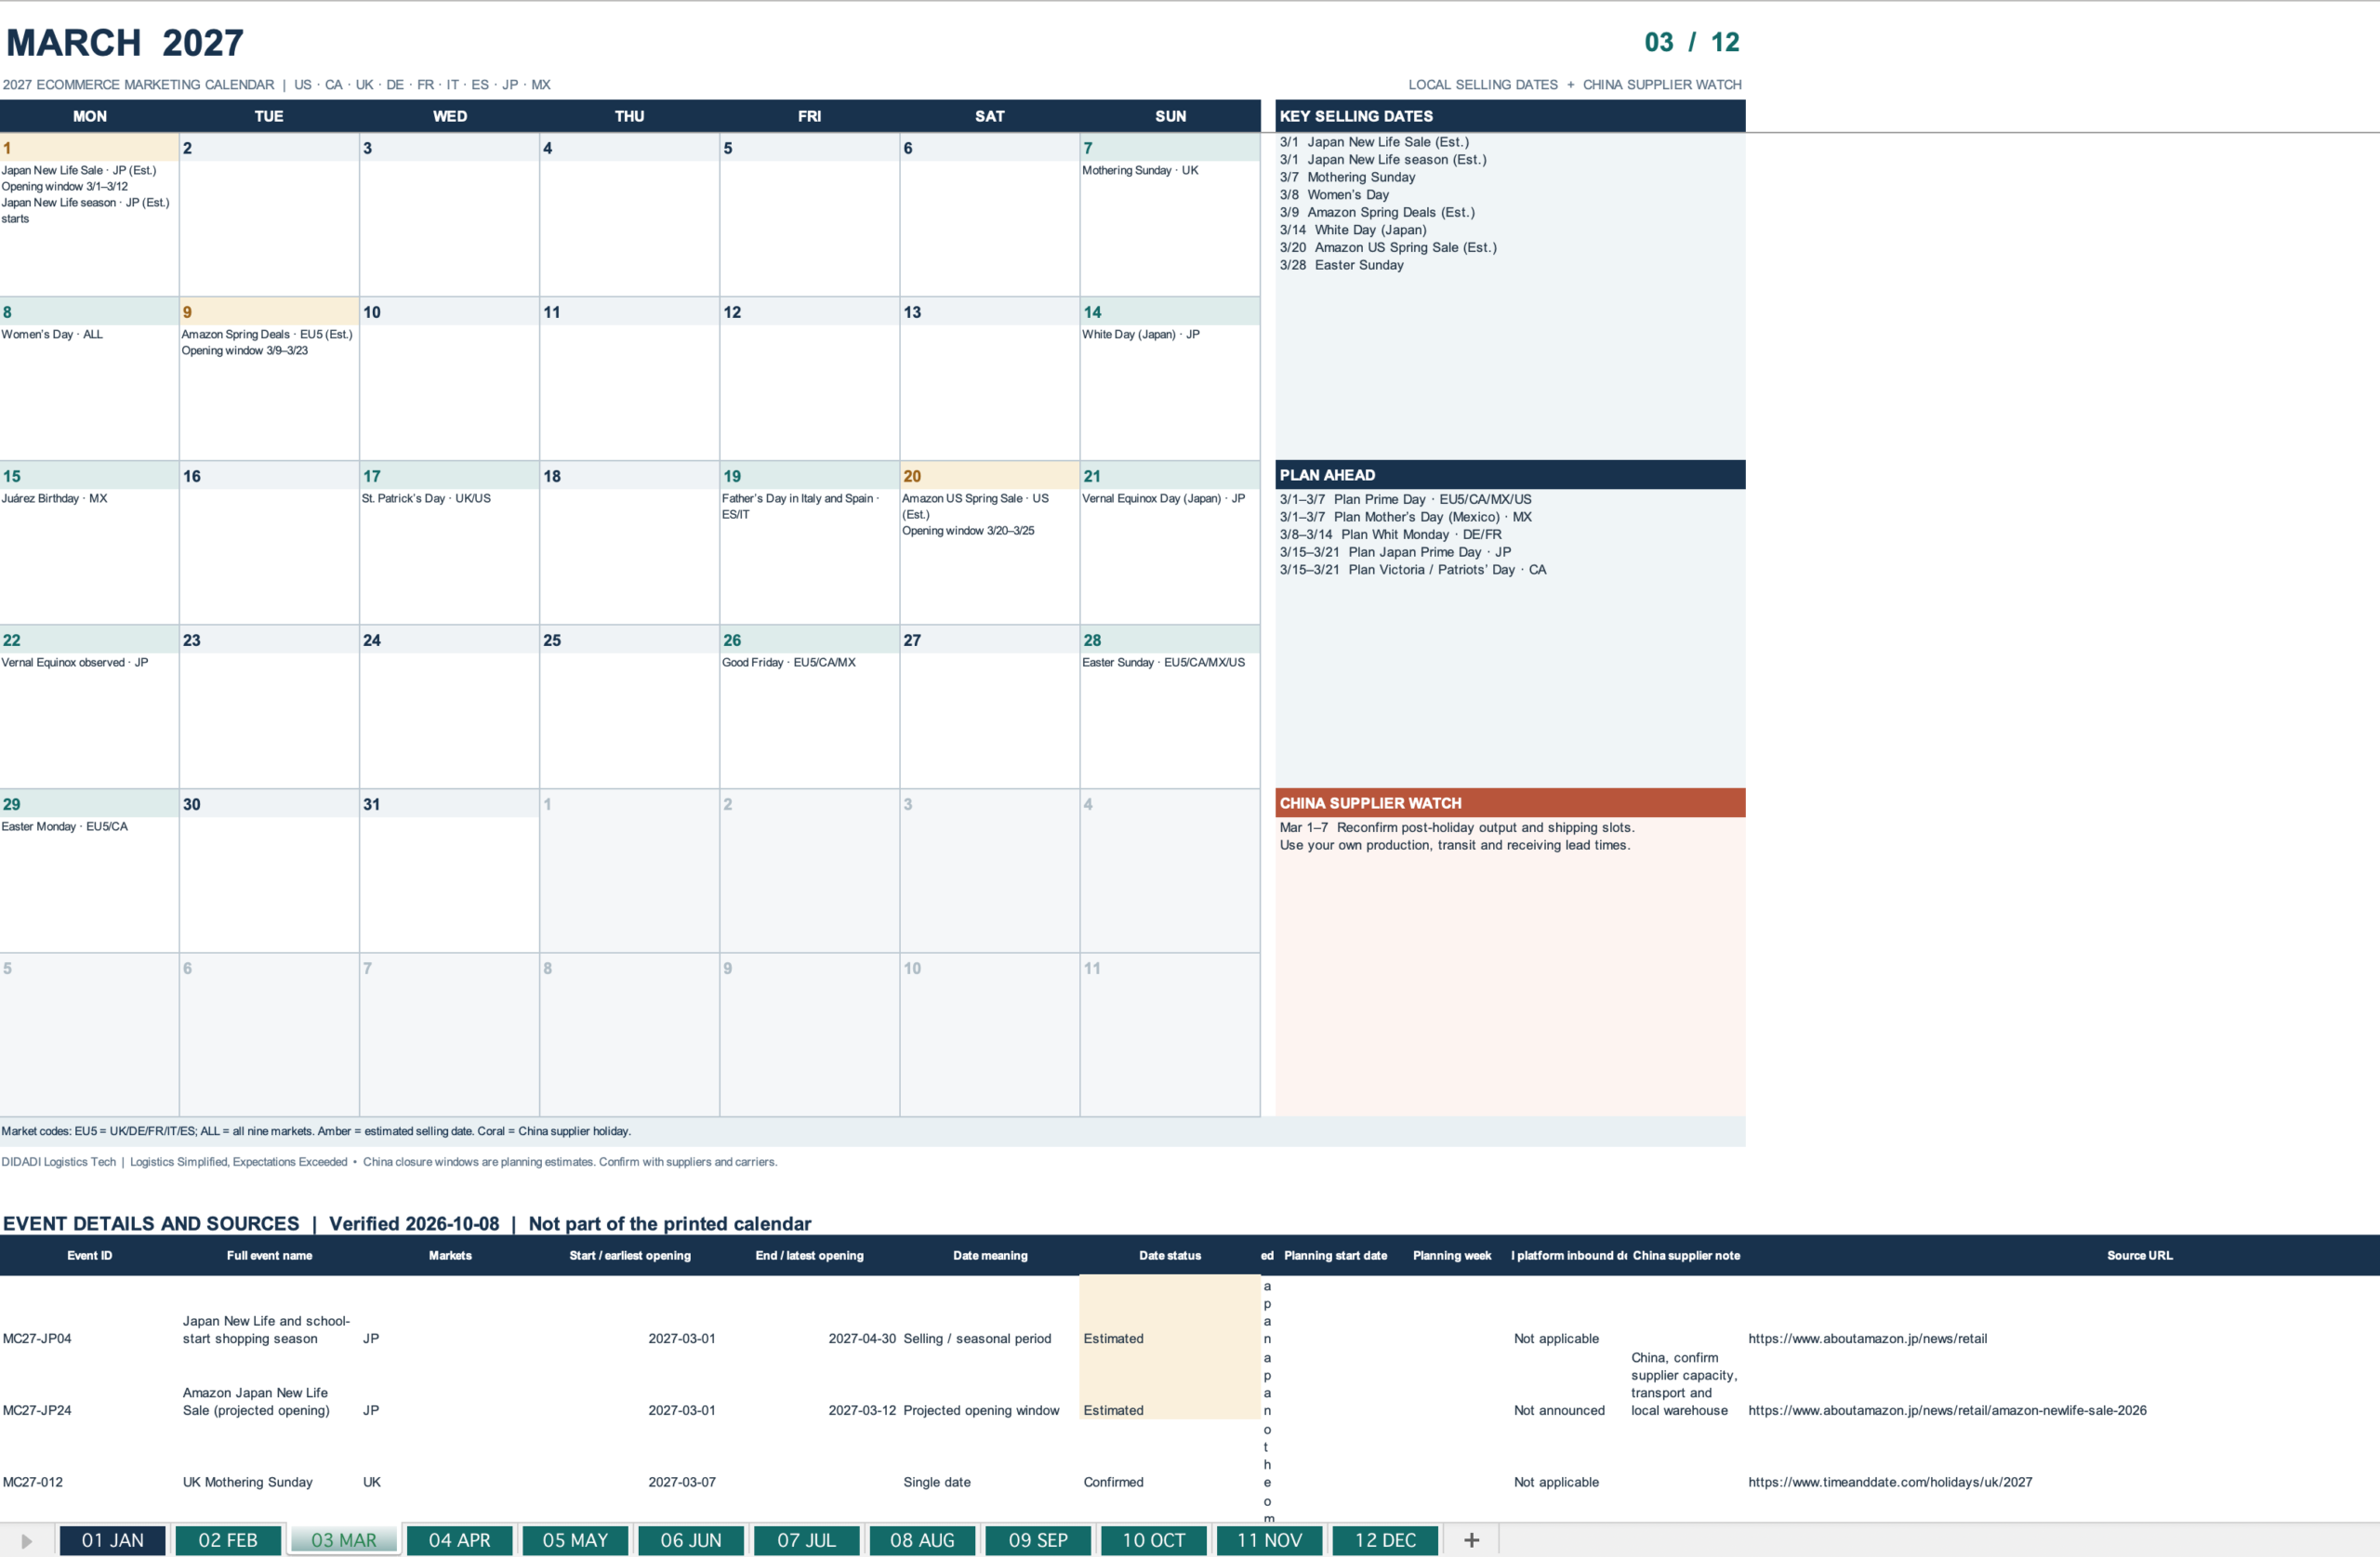
A successful marketing calendar 2027 requires teams to schedule production cutoffs and freight bookings backward from target sales dates rather than relying on on-shelf launch targets. Instead of tracking retail holidays, importers must map factory lead times, ocean transit windows, customs clearance buffers, and destination distribution center receiving times to ensure inventory arrives on time.
In my daily client consultations at DIDADI Logistics Tech, I see brilliant promotional plans collapse due to predictable freight bottlenecks. Let us break down how you can shift from an outdated launch-date mindset to a resilient, lead-time-driven operational model for 2027.
Why Does a Traditional Marketing Calendar 2027 Fail Without Reverse Logistics?
Promotional calendars look great on paper, but standard launch timelines ignore the physical limits of overseas manufacturing and international shipping. When your marketing team schedules a Q4 campaign without checking supplier capacity or peak shipping surcharges, you risk empty shelves and emergency freight bills. Grounding your schedule in reverse logistics prevents this disaster.
A traditional marketing calendar 2027 fails because it tracks when products should sell rather than when purchase orders must be released. It overlooks non-negotiable supply chain milestones, including raw material procurement, factory holiday shutdowns like Chinese New Year2, port dwell times, and destination terminal congestion.

The Disconnect Between Creative Campaigns and Factory Floors
In our customer intake meetings, brand managers frequently tell me they plan to launch their autumn campaigns in early September. When I ask when their supplier in Ningbo or Shenzhen will finish packaging, they often point to late July. That leaves barely five weeks to handle origin drayage, ocean transit to the US West Coast or European base ports, customs clearance, and inbound receiving at an Amazon fulfillment center or regional 3PL.
This narrow buffer leaves zero room for real-world friction. If the supplier experiences a minor raw material delay of seven days, the cargo misses its scheduled vessel cut-off. Missing a weekly sailing pushes origin departure back by another seven to ten days.3 Suddenly, stock arrives in mid-October, completely missing the promotional window.
Why You Must Reverse-Engineer Your Deadlines
To prevent these costly missteps, you must calculate dates in reverse:
- Destination Inbound Buffer: Schedule 14 to 21 days for unloading, sorting, and cross-docking at your distribution facility.
- Customs and Dwell Buffer: Add 5 to 10 days for clearance processing, physical document checks, and terminal container retrieval.
- Ocean and Port Transit: Factor in variable ocean sailing times depending on whether you ship to the US West Coast, US East Coast, or North European ports.
- Factory Production Run: Account for manufacturing lead times, which typically range from 30 to 60 days4 following purchase order placement.
When you add these stages together, an autumn product launch scheduled for September 1 requires a verified purchase order placed no later than April or early May.
How Does the Fallacy of Fixed Transit Lead Times Destroy Your Retail Deadlines?
Importers frequently treat freight quotes as set-in-stone shipping promises, assuming transit times never vary. When ocean freight encounters weather disruptions, terminal congestion, or extended customs holds, that fixed timeline breaks down instantly. Relying on baseline freight transit without adding operational buffers will derail your retail schedules.
Fixed transit assumptions fail because shipping quotes represent ideal port-to-port ocean transit rather than actual door-to-door delivery5. Port dwell times, blank sailings, chassis shortages, customs examinations, and warehouse receiving queues fluctuate constantly throughout the year, especially during seasonal shipping peaks.

The Gap Between Port-to-Port Quotes and Door-to-Door Delivery
I often speak with buyers who tell me, "My quote says 14 days from Shanghai to Los Angeles." While the vessel might indeed cross the Pacific Ocean in 14 days, ocean transit is only one step of the journey. Cargo does not materialize in your warehouse the moment a container vessel drops anchor.
[Factory Ready Date]
       ↓ (3-5 days origin handling & export clearance)
[Vessel Departure]
       ↓ (14-35 days ocean transit depending on trade lane)
[Port Arrival & Vessel Discharge]
       ↓ (3-7 days container dwell & import clearance)
[Inland Drayage & Final Delivery]
       ↓ (2-5 days road/rail transit)
[Warehouse Unloading & Final Check-in] (3-14 days receiving queue)
During peak volume periods, terminal operators experience container stacking backlogs. If your container gets placed in a closed stack or encounters a random customs document review, your container can sit at the destination terminal for an extra five to ten days6.
Seasonal Variables You Must Factor Into 2027 Plans
Lead times fluctuate dramatically across different quarters. A shipment booked in March will not move at the same speed as an identical shipment booked in October.
| Season / Quarter | Shipping Conditions | Estimated Buffer Needed | Primary Bottleneck Risk |
|---|---|---|---|
| Q1 (Pre/Post CNY) | Factory shutdowns, rushed pre-holiday departures | Add 15–20 days to standard timelines | Blank sailings and skeleton factory staffing |
| Q2 (Spring Rebound) | Stable volume, predictable equipment availability | Add 5–7 days to standard timelines | Factory raw material replenishment cycles |
| Q3 (Pre-Holiday Peak) | Heavy cargo volumes, vessel rollovers | Add 15–25 days to standard timelines | Space constraints, equipment shortages at origin |
| Q4 (Holiday Rush) | Severe terminal and warehouse congestion | Add 20–30 days to standard timelines | Extended 3PL and Amazon FBA inbound queues |
How Should You Build a Lead-Time-First Marketing Calendar 2027 for China Sourcing?
Building an operational schedule requires locking in procurement orders months ahead of traditional creative targets. If you wait for finished marketing assets before cutting purchase orders, your products will arrive long after your campaigns launch. A lead-time-first calendar aligns procurement milestones directly with factory production schedules.
To build a lead-time-first marketing calendar 2027, map each major retail event backward by 90 to 120 days. Establish non-negotiable purchase order cut-offs, classify inventory by supply vulnerability, and set strict shipping deadlines to protect your promotional launch dates.

2027 Key Retail Milestones Mapped to Sourcing Reality
To keep your marketing calendar 2027 reliable, align your critical campaigns with these hard operational deadlines:
1. Valentine’s Day & Early Spring Campaigns (February 2027)
- Target In-Store / Live Date: Late January 2027
- Latest Port Arrival: January 5, 2027
- Mandatory Vessel Departure: December 5, 2026
- Purchase Order Cut-off Date: September 15–30, 2026
- Logistics Note: You must move this stock well ahead of the pre-Chinese New Year export rush to avoid peak season container premiums.
2. Summer Prime Day & Mid-Year Promotions (July 2027)
- Target In-Store / Live Date: Late June 2027
- Latest Port Arrival: May 25, 2027
- Mandatory Vessel Departure: April 20, 2027
- Purchase Order Cut-off Date: February 1, 2027
- Logistics Note: The post-Chinese New Year factory ramp-up is often slow. If your PO is not placed before factories break for the holiday, production will not start until late February.
3. Back-to-School Campaigns (August / September 2027)
- Target In-Store / Live Date: July 20, 2027
- Latest Port Arrival: June 20, 2027
- Mandatory Vessel Departure: May 15, 2027
- Purchase Order Cut-off Date: March 1, 2027
- Logistics Note: Shipping during late May helps you get ahead of the general rate increases (GRIs) that ocean carriers roll out during the Q3 peak7.
4. Black Friday, Cyber Monday & Holiday Q4 (November / December 2027)
- Target In-Store / Live Date: October 25, 2027
- Latest Port Arrival: September 15, 2027
- Mandatory Vessel Departure: August 10, 2027
- Purchase Order Cut-off Date: May 15, 2027
- Logistics Note: Fulfillment centers strictly enforce inventory cut-off windows for Q4. Missing these check-in dates by even 48 hours can delay inventory receiving until January.
Categorizing Products by Supply Risk
Not all SKUs require the same production buffer. Divide your catalog into two practical procurement tiers:
- Core Replenishments: High-velocity catalog items using proven molds and standard packaging. These require steady, rolling 60-day replenishment orders to absorb container transit variance.
- Custom or Novelty Items: Seasonal colorways, holiday packaging, or newly engineered products. Build in an extra 30 days of production buffer to handle tooling adjustments, sample sign-offs, and pre-shipment quality inspections.
How Can Importers Balance Inventory Carrying Costs Against Stockout Risks in 2027?
Ordering inventory months in advance protects your sales dates, but holding stock too early ties up valuable working capital and increases warehouse storage fees8. Conversely, ordering too late forces you to pay exorbitant air freight rates to save the campaign. Balancing storage costs against potential stockouts keeps your supply chain both resilient and profitable.
Importers can balance carrying costs and stockout risks by using staggered shipping models. Ship baseline inventory via economical ocean freight well ahead of deadlines, and keep a flexible manufacturing buffer ready to move via premium ocean services or commercial air freight if sales outpace forecasts.

The Real Cost of Emergency Freight
When production runs late, companies often default to air freight to protect a promotional date. However, air shipping costs can quickly wipe out your campaign's profit margins9.
Consider an e-commerce seller importing 3,000 units of an outdoor consumer good:
- Ocean Freight (FCL/LCL): Moves at roughly $0.20 to $0.60 per unit, leaving healthy room for advertising spend.
- Expedited Air Freight: Often costs between $4.50 and $8.00 per unit, depending on volumetric weight and fuel surcharges.
Spending an extra $15,000 on emergency air freight directly erodes your return on ad spend. Rushing cargo through the air saves the campaign's launch date, but it often destroys the underlying profit margin.
Tactical Framework for Inventory Timing
To protect your cash flow without risking stockouts during peak promotional dates, implement these three practices:
- Split-Shipment Deployments10: Ship 70% to 80% of your projected holiday inventory via economical standard ocean freight early in the season. Hold the remaining 20% at your origin supplier's warehouse or an origin consolidation hub, shipping it via fast-boat ocean services only when initial sales data validates demand.
- Third-Party Warehousing Off-Loads: Avoid high long-term storage fees at Amazon fulfillment centers by routing initial ocean receipts to a private 3PL warehouse. Drip-feed inventory into fulfillment centers to maintain high inventory turnover scores while avoiding peak warehouse storage surcharges.
- Cross-Department Milestone Sign-offs: Establish bi-weekly alignment meetings between your marketing managers and logistics teams. If a factory reports a component delay, marketing must adjust promotional ad pacing immediately—long before cargo misses the boat.
Frequently Asked Questions
What is the most critical supply chain bottleneck when planning a marketing calendar 2027?
The biggest bottleneck is the annual factory shutdown for Chinese New Year, which usually occurs in January or February. Production halts entirely for two to three weeks, and output takes another two to three weeks to return to full capacity.11 Always finalize spring inventory orders before the pre-holiday rush.
How much buffer time should I add to ocean freight shipments from China?
We recommend adding an operational buffer of 14 to 21 days beyond quoted ocean sailing times12. This window protects your delivery schedule against adverse weather, vessel blankings, destination port terminal dwell times, customs clearance paperwork reviews, and distribution center inbound receiving queues.
Can air freight reliably save a late-running marketing campaign?
Air freight gets cargo to destination markets quickly, but it is rarely a cure-all. Air cargo spaces tighten rapidly during Q4 peak seasons, rates spike dramatically, and destination clearance dwell times still apply. Moving bulky retail inventory via air often erodes your campaign's entire profit margin.
When should our team finalize our marketing calendar 2027 purchase orders?
You should finalize purchase orders between 90 and 120 days before your products need to be available for purchase. For complex, newly developed products requiring custom tooling or extensive quality testing, increase that procurement window to 150 days.
Conclusion
A successful marketing calendar 2027 is built on the physical realities of manufacturing queues, freight transit, and port dwell times—not just optimistic promotional launch dates. Importers who reverse-engineer their operations protect their margins, eliminate emergency freight expenses, and keep their products reliably stocked on retail shelves.
At DIDADI Logistics Tech, we help US and European importers, wholesalers, and e-commerce brands navigate complex global supply chains. From end-to-end ocean freight and air cargo to customs clearance and door-to-door fulfillment delivery, our team ensures your inventory lands right when your marketing campaigns need it. Contact DIDADI Logistics Tech today to audit your 2027 shipping schedules and build a resilient logistics plan.
"Product Innovation: 95% of new products miss the mark", https://professionalprograms.mit.edu/blog/design/why-95-of-new-products-miss-the-mark-and-how-yours-can-avoid-the-same-fate/. Cross-sectional analyses of consumer goods commercialization demonstrate that between 60% and 80% of new product introductions fail to meet revenue expectations, though failure rates vary by product category and retail format. Evidence role: statistic; source type: paper. Supports: Supports the premise that new product market entries encounter high baseline failure rates across retail and consumer sectors.. Scope note: Surveys and meta-analyses on product failure rates aggregate across categories and often measure failure by divergent criteria, such as missed sales quotas versus permanent discontinuation. ↩
"Chinese New Year and its Impact on Global Supply Chain", https://ctl.mit.edu/news/chinese-new-year-and-its-impact-global-supply-chain. Empirical studies of Asian export logistics confirm that Lunar New Year induces structural manufacturing shutdowns lasting several weeks, producing substantial pre-holiday cargo surges followed by sharp declines in factory dispatch. Evidence role: mechanism; source type: paper. Supports: Documents the periodic contraction in factory output and cargo volume associated with Chinese New Year factory shutdowns.. ↩
"Research on comprehensive recovery of liner schedule and ...", https://pmc.ncbi.nlm.nih.gov/articles/PMC9351600/. Maritime transport analyses by the United Nations Conference on Trade and Development (UNCTAD) note that deep-sea container liner services operate predominantly on fixed-day weekly service rotations, meaning missed terminal deadlines inherently defer freight to subsequent weekly loops. Evidence role: mechanism; source type: institution. Supports: Explains how standard fixed-day weekly liner service networks translate missed cut-offs into multi-day departure deferrals.. Scope note: Applies primarily to major long-haul maritime corridors; high-density loops may offer alternative multi-carrier sailings within the same week. ↩
"Why Focusing on Lead Time, Not Just Efficiency and Cost ...", https://interpro.wisc.edu/lead-time-drives-manufacturing-success/. Procurement research indicates that off-shore contract manufacturing lead times for finished consumer products frequently average 4 to 8 weeks, depending on component availability and production batch sizes. Evidence role: general_support; source type: education. Supports: Provides benchmark data on standard contract production lead times for consumer discrete goods.. Scope note: Lead times vary significantly between off-the-shelf assemblies and custom-tooled original design manufacturing. ↩
"Transit Time Calculator for Sea, Air & Port To Port Shipping", https://www.freightos.com/freight-resources/transit-time-calculator/. Supply chain literature underscores that port-to-port ocean passage represents only a fraction of total transit duration, with intermodal transfer, drayage, and customs clearance introducing significant landside lead-time variation. Evidence role: definition; source type: paper. Supports: Clarifies the conceptual and operational distinction between maritime port-to-port sailing times and comprehensive intermodal delivery.. ↩
"Vessel Berthing Times - BTS Data Inventory", https://data.bts.gov/stories/s/Vessel-Berthing-Times/4kd6-2t87/. Federal freight tracking data from the Bureau of Transportation Statistics illustrates that marine terminal container dwell times frequently exceed 5 to 7 days during periods of terminal yard congestion and regulatory inspection holds. Evidence role: statistic; source type: government. Supports: Provides empirical metrics on container dwell time fluctuations at gateway marine terminals during operational friction or administrative holds.. Scope note: Dwell time metrics vary substantially by individual port terminal, season, and whether containers move via rail or truck drayage. ↩
"GRI (General Rate Increase) Meaning in Shipping", https://airliftusa.com/glossary/general-rate-increase-gri. Filings compiled by the Federal Maritime Commission demonstrate that liner operators regularly schedule General Rate Increases and peak season surcharges starting in mid-summer to capture demand ahead of autumn retail inventory build-ups. Evidence role: mechanism; source type: government. Supports: Explains regulatory reporting and the economic deployment of seasonal General Rate Increases by container ship alliances ahead of holiday retail surges.. Scope note: Carriers frequently announce GRIs that are subsequently discounted or mitigated based on real-time spot market capacity negotiations. ↩
"A comparison of inventory carrying cost in literature and in ...", https://dr.lib.iastate.edu/bitstreams/8d2b0874-381d-4752-b619-a8d340042d5d/download. Classical operations research models demonstrate that total inventory carrying costs typically represent 15% to 30% of inventory value annually, primarily driven by tied-up capital opportunity costs and warehousing warehousing expenditures. Evidence role: mechanism; source type: paper. Supports: Establishes the trade-off between early stock acquisition and elevated inventory carrying costs comprising capital, storage, and obsolescence risks.. ↩
"Air Freight: A Market Study with Implications for Landlocked ...", https://www.worldbank.org/en/topic/transport/publication/air-freight-study. World Bank freight transport assessments record that commercial air freight typically costs 4 to 8 times more per kilogram than maritime shipping on equivalent long-haul corridors, significantly impairing gross margins on bulky consumer retail items. Evidence role: statistic; source type: institution. Supports: Quantifies the systemic freight rate multiplier between commercial air freight and maritime shipping on global trade lanes.. Scope note: Freight cost ratios vary dynamically with fluctuating jet fuel surcharges and spot-market maritime blank sailings. ↩
"Dual-Sourcing, Dual-Mode Dynamic Stochastic Inventory ...", https://papers.ssrn.com/sol3/papers.cfm?abstract_id=3885147. Operations research into dual-modal logistics demonstrates that splitting procurement commitments into a primary slow-transit baseline and a responsive secondary tranche reduces both stockout probability and excess holding cost under demand volatility. Evidence role: general_support; source type: paper. Supports: Supports the optimization principle of bifurcating inventory orders into low-cost baseline replenishment and agile replenishment reserves.. Scope note: The operational benefit depends on accurately estimating the cost threshold where secondary expedited logistics costs exceed holding savings. ↩
"Chinese New Year and its Impact on Global Supply Chain", https://ctl.mit.edu/news/chinese-new-year-and-its-impact-global-supply-chain. Economic studies on Chinese manufacturing seasonality indicate that the Chunyun travel period generates an absolute factory hiatus of 14 to 20 days, with post-holiday labor turnover and retraining delaying full productivity restoration for an additional two to four weeks. Evidence role: mechanism; source type: research. Supports: Explains the multi-week operational lag caused by Spring Festival national labor migration and subsequent workforce onboarding.. ↩
"Global schedule reliability drops to 62.8% in December 2025", https://sea-intelligence.com/press-room/368-global-schedule-reliability-drops-to-62-8-in-december-2025. Maritime schedule tracking reports indicate that global container liner on-time reliability historically hovers between 40% and 65%, with late arrivals averaging 4 to 6 days of vessel delay prior to terminal discharge. Evidence role: expert_consensus; source type: research. Supports: Provides context on historical container liner schedule unreliability, supporting the operational necessity of multi-week planning buffers.. Scope note: Schedule reliability varies widely depending on specific trade lanes, carrier alliance performance, and regional port labor conditions. ↩